This report is not a personal recommendation and does not take into account your personal circumstances or appetite for risk.
2 September 2018
Bargain Blue Chips ’18
[vc_row][vc_column width="1/1"][vc_column_text]What a difference a quarter can make for UK 100 index of London’s blue chips. After rising through most of the spring to reach new record highs of 7903 in late May, much of the index’s hard-earned gains evaporated in the summer’s heatwave alongside hopes and dreams of England’s football squad.
Many investors who prefer to trade for the long term are likely disappointed by moribund index performance, with UK 100 -2.15% year-to-date, and are looking for more volatile trading options that offer big market moves in the short term.
One strategy that is favoured by UK Index investors is to seek out undervalued companies that have lost a significant percentage of their share price and can offer attractive potential for a bounce back to what investors feel represents their “fair value”. But how can they be found? Is any nominally cheap stock a tradable opportunity or is there more to this search?
Here’s a hint: be on the lookout for smoke signals to find a great bargain blue chip stock.
Search criteria
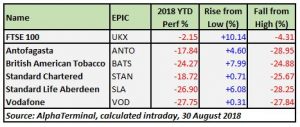
With 49 of UK Index ’s 100 big name components technically negative since the beginning of the year, investors are spoiled for choice in terms of picking up cheaper stocks leading into September’s anticipated uptick in market volatility.
But not all UK 100 bargain stocks are alike. Shares of companies like Micro Focus may be nearly 48% below 2018 highs, but they already bounced around 69% from the lows, potentially exhausting their upside potential in the medium term.
The key to spotting an attractive bargain opportunity lies in balancing the “cheapness” of the stock with a reliable support level. Even better would be to see a small rebound that partially retraces prior losses to indicate that shares don’t plan to go even lower, without consuming too much of the upside.
State of the UK Index
Speaking of UK 100 as a whole, two key themes dominated the index this year: growing possibility of the so-called “no-deal Brexit” and the impact of the spreading global trade war.
Negotiations between government envoys on the orderly withdrawal from the political bloc are at an impasse over conditions for future UK/EU customs relationship and border status. Deadline for final agreement has been pushed back repeatedly, raising the likelihood that no agreement would be reached in time before final 29 March 2019 Brexit deadline.
This creates uncertainty for UK 100 companies that are exposed to EU markets through trading relationships, need for market access or capital inflows.
On a more global scale, the multilateral “trade war” between China, US and EU is also hitting hard those UK 100 shares that are either commercially tied to China and other tariff-impacted markets or face significant FX headwinds from the appreciating US Dollar. As most commodities are priced in USD, a sustained recent Dollar rally that is supported by American protectionist policies is hitting the UK Index ’s heavyweight resource sector hard.
Continue reading for more specific examples of UK 100 stocks that have seen significant devaluation in the first half of the year.
For additional analytical coverage of key UK 100 companies, you can also sign up to have our research sent directly to your inbox.[/vc_column_text][/vc_column][/vc_row]
[vc_row][vc_column width="1/1"][vc_column_text]
Dialling the wrong number
World’s second-largest mobile provider Vodafone is the only telecom stock on UK 100 , but it occupies an outsize presence in many investors’ portfolios. The stock has not fared well in 2018, falling ~28% year-to-date and currently trading close to levels last seen in 2013. Company’s decision to spend $23bn in the beginning of the year on Liberty Global telecom assets in Europe spooked investors and the departure of a long-serving CEO Vittorio Colao added to market’s uncertainty regarding Vodafone’s direction.
Copper miner Antofagasta is the most recent victim of Sino-US trade confrontation. As a top producer of red metal, China has an outside impact on metals & mining companies and the new tariffs which President Trump has put on Chinese imports have severely hurt UK Index ’s Mining sector. Antofagasta is sector’s biggest laggard, falling ~29% from 2018 highs and bouncing back the least (~5%) from the lows compared to peers. Half-year results in mid-August fell short of expectations, as copper production decreased while costs rose.[/vc_column_text][/vc_column][/vc_row][vc_row][vc_column width="1/1"][vc_column_text]
Rainy day savings
Financial sector has been another 2018 laggard, with wealth management company Standard Life Aberdeen the biggest sector faller on UK 100 . Shares in the firm that manages many of the UK’s corporate pension schemes have fallen close to 27% since the beginning of the year. The chain of disappointing news started in February when Lloyds terminated the £109bn insurance management arrangement and continued when S&P credit ratings agency downgraded the company in August due to track record of sustained net fund outflows.
Emerging markets-focused bank Standard Chartered is another firm which has not done well in 2018, its share price down 19% in 2018 and currently trading near recent lows (having bounced less than 1% from the year’s bottom). Half-results were relatively downbeat, and the bank remains under the shadow of US investigation into its sanctions-busting activities in Iran. Bank’s exposure to Asian emerging markets has also hurt Standard Chartered due to the ongoing concerns over the aftereffects of US-China reciprocal trade confrontation spreading to other regional economies.[/vc_column_text][/vc_column][/vc_row][vc_row][vc_column width="1/1"][vc_column_text]
Smoke and mirrors
 Another company that has not been able to benefit from UK Index ’s Q1 rush to record highs was the tobacco products manufacturer British American Tobacco. As a defensive company, its shares typically suffer during periods of market rallies, when investor sentiment gives preference to riskier assets. With UK Index ’s rise aborted during the summer, BAT shares are coming back into favour. Recent results pleased investors, as revenues rose 57% YoY and the company gained bigger portion of cigarette market share.
Over the next several pages, we discuss the technical aspects of these 5 bargain stocks, including medium-term charts, potential support and resistance levels, as well as broker recommendations and target prices.
Do you have an opinion of what will happen to these stocks in the second half of 2018 and want to take advantage of a tradable opportunity? Get in touch with one of our brokers to discuss your options.[/vc_column_text][/vc_column][/vc_row]
[vc_row][vc_column width="1/1"][vc_column_text]
Antofagasta (ANTO)

Source: CMC Markets, 30 August 2018
Will Antofagasta go to July highs of 1012p (+23%) or fall to June 2017 lows of 747p (-9%)?
- Sharp sell-off from June 2018 highs, with shares down ~29% from 2018 highs.
- Downtrend on the back of global trade tensions, strengthening USD and falling copper prices.
- Bounced from falling lows support level dating back to August 2017, reversing ~5% of losses.
- RSI and Stochastics are turning higher, indicating a bullish signal.
- ADX (trend strength) is increasing, supporting the uptrend.
- Brokers are split, but with a bias toward positive, with 40% saying “Buy”
- 68% of brokers see an upside from current price levels, indicating an average target price of 943p.
- According to analysts at RBC Capital Markets (24 August 2018), Antofagasta’s second-half prospects are better than H1 performance and that the current cheap valuation is a “compelling entry point following the recent sell-off”.
Broker Consensus: 40% Buy, 28% Hold, 32% Sell
Bullish: Jefferies, Buy, Target 1300p, +53% (27 August 2018)
Average Target: 943.71p, +11% (28 August 2018)
Bearish: Liberum, Sell, Target 535p, -37% (1 July 2018)
Pricing data sourced from Bloomberg on 30 August 2018. Please contact us for a full, up to date rundown.[/vc_column_text][/vc_column][/vc_row][vc_row][vc_column width="1/1"][vc_column_text]
British American Tobacco (BATS)

Source: CMC Markets, 30 August 2018
Will BAT return to February level of 4512p (+19%) or fall to June lows of 3594p (-5%)?
- British American Tobacco (BAT) shares have been in a downtrend through first quarter of 2018.
- Downtrend stabilized in April-May, with shares in a sideways trend since then.
- Shares are down ~25% since the beginning of the year but have clawed back ~10%.
- Late August sell-off an indication of a potential new range between 3795p and 4239p.
- Brokers are overwhelmingly bullish on BAT shares, with a healthy 95% of brokers expecting share prices to rise in the medium-term to an average target of 4755p (February 2018 highs).
- Analysts at Barclays (10 August 2018) are saying that BAT is well-prepared to handle new tobacco products, pointing to the tobacco-maker’s consistent strategy and good balance in terms of products and geographical coverage. “Shares look cheap versus history”, says the brokerage.
Broker Consensus: 77% Buy, 18% Hold, 5% Sell
Bullish: Investec, Buy, Target 5500p, +42% (26 July 2018)
Average Target: 4755.88p, +22% (28 August 2018)
Bearish: DZ Bank, Sell, Target 3650p, -6% (31 July 2018)
Pricing data sourced from Bloomberg on 30 August 2018. Please contact us for a full, up to date rundown.[/vc_column_text][/vc_column][/vc_row][vc_row][vc_column width="1/1"][vc_column_text]
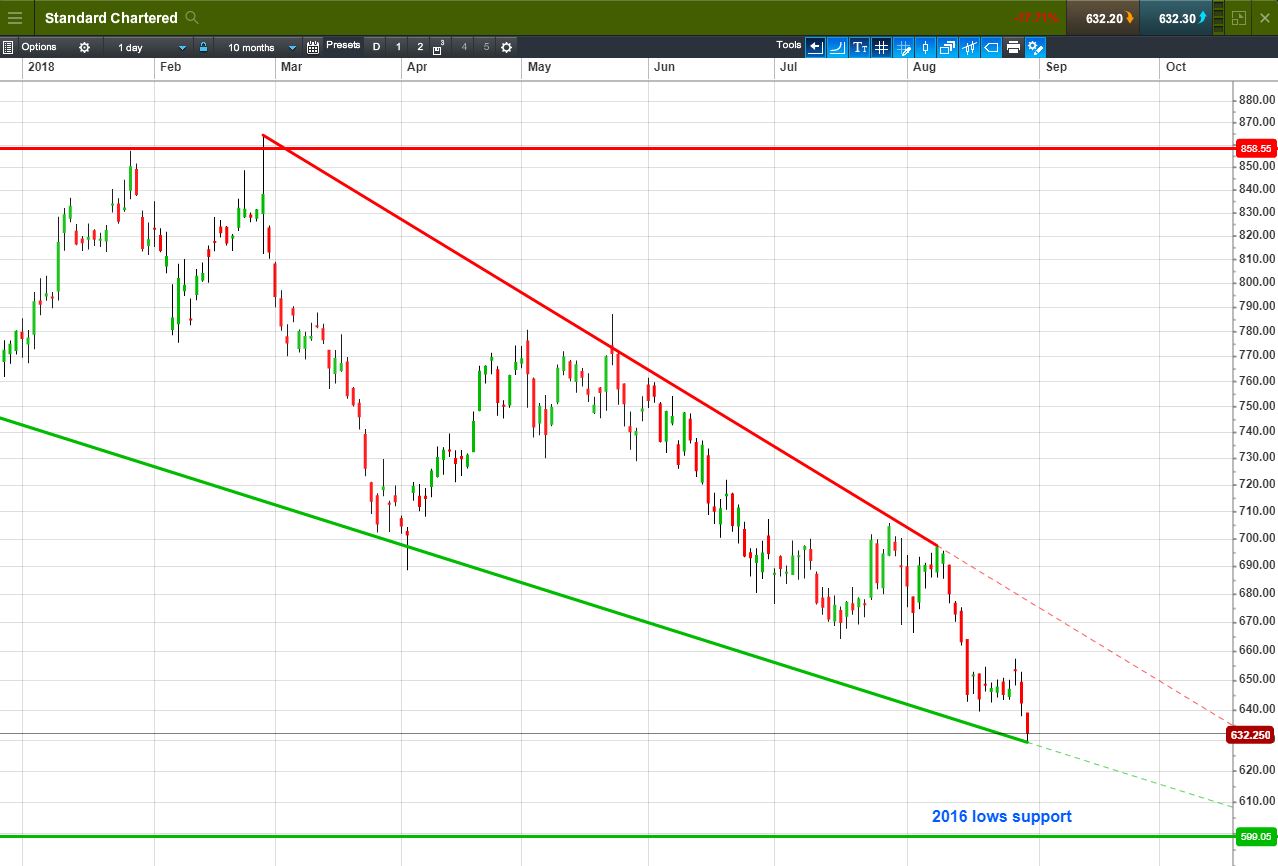
Standard Chartered (STAN)

Source: CMC Markets, 30 August 2018
Will Standard Chartered revisit 787p May highs (+24%) or fall to 599p 2016 lows (-5%)?
- Standard Chartered shares trending lower since early 2018, with a falling narrowing channel.
- Shares have lost nearly 19% year-to-date, falling ~26% from 2018 highs reached in February.
- Technical indicators are moving up, supporting the case for a share price bounce from channel floor
- Brokers are neutral, evenly split between those saying “Buy” and “Hold”, with a significant minority saying “Sell”. Broker target prices are bullish, with 73% of brokers seeing a rise back to mid-June levels
- According to analysts at HSBC (1 August 2018), Standard Chartered shares may have already bottomed out, as the stronger USD is providing good news when bank’s earnings are translated back into a sterling-denominated share price.
- US investigation into the bank’s Iran business could provide more bearish pressure on shares.
Broker Consensus: 36% Buy, 36% Hold, 28% Sell
Bullish: Value Investment Principals, Buy, Target 1050p, +60.3% (1 August 2018)
Average Target: 739.13p, +12% (28 August 2018)
Bearish: Jefferies, Underperform, Target 348p, -47% (14 August 2018)
Pricing data sourced from Bloomberg on 30 August 2018. Please contact us for a full, up to date rundown.[/vc_column_text][/vc_column][/vc_row][vc_row][vc_column width="1/1"][vc_column_text]
Standard Life Aberdeen (SLA)

Source: CMC Markets, 30 August 2018
Will Standard Life return to 445p highs (+40%) or break down to 2018 low of 301p (-6%)?
- Shares in a 2018 downtrend, having lost nearly 27% since the beginning of 2018.
- Bullish bounce in August away from long-term 9-year rising support.
- Shares recently attempting a test of the ceiling of a 10-month falling channel.
- MACD has broken above the centreline, supporting the case for a potential breakout.
- Analysts at UBS are saying that the acceleration of the share buyback programme is positive for shares despite tough six months (7 August 2018).
- Brokers are bullish, with only 3 analysts out of 18 recommending “Sell”.
- Most brokers are seeing an upside for the shares, with only 1 broker’s target below current levels.
- The rest are forecasting a return to February highs around 418p.
Broker Consensus: 67% Buy, 17% Hold, 17% Sell
Bullish: Jefferies, Buy, Target 488p, +47% (28 August 2018)
Average Target: 418.82p, +26% (28 August 2018)
Bearish: Day by Day, Sell, Target 222.5p, -33% (27 August 2018)
Pricing data sourced from Bloomberg on 28 August 2018. Please contact us for a full, up to date rundown.[/vc_column_text][/vc_column][/vc_row][vc_row][vc_column width="1/1"][vc_column_text]
Vodafone (VOD)

Source: CMC Markets, 30 August 2018
Will Vodafone bounce back to 214p April highs (+27%) or fall back to 2012’s 154p bottom (-9%)?
- Vodafone shares have fallen over 26% year-to-date, breaking below June 2013 lows.
- Any potential rebound is still in the future, with shares less than 1% away from 2018 lows.
- In its latest trading update (25 July 2018), Vodafone has reiterated FY guidance, pointing to strong trading in Germany and a recovery in the UK market.
- Bundling of TV, phone and broadband services is helping Vodafone retain customers.
- Majority of brokers are holding a bullish outlook on Vodafone, with 64% saying “Buy” and an overwhelming 79% projecting a medium-term bounce back to the share price level around 221p last seen in January 2018.
Broker Consensus: 64% Buy, 18% Hold, 18% Sell
Bullish: ROE Equity Research, Buy, Target 300p, +71% (14 November 2017)
Average Target: 221.76p, +26% (28 August 2018)
Bearish: Macquarie, Underperform, Target 135p, -23% (7 August 2018)
Pricing data sourced from Bloomberg on 30 August 2018. Please contact us for a full, up to date rundown.[/vc_column_text][/vc_column][/vc_row]
[vc_row][vc_column width="1/1"][vc_column_text]
Want to take advantage of the above opportunities right now?
Whether you see UK Stocks going up or down for the remainder of the year, tradable opportunities will present themselves regularly. We’re here to help you weed them out and capitalise on them. Accendo Markets can help you increase your profit potential with the use of leveraged instruments such as CFDs, a flexible alternative to traditional shares that is currently exempt from UK stamp duty.
[/vc_column_text][/vc_column][/vc_row][vc_row][vc_column width="1/2"][vc_column_text]
[/vc_column_text][vc_column_text]
[/vc_column_text][vc_column_text]

[/vc_column_text][/vc_column][vc_column width="1/2"][vc_column_text]
CFDs: Like shares, but more flexible
While buying 9,561 shares in IQE @ 104.58p requires an outlay of around £10,000 plus commission, the same exposure via a CFD requires about £2000 plus commission (see right-hand box; margin + costs). If a trader invests in IQE, one would assume they believe the share price is likely to move in their favour. After considering the ‘worst case scenario’ and assigning funds to cover it, the trader may conclude there’s little point in exposing the full £10,000 to IQE shares - some of that capital could be put to good use elsewhere in the markets. (Source: CMC, Prices indicative)
CFDs are leveraged instruments, but you don’t have to use leverage
If you had, say, £10,000 to invest in the stock market, you could deposit that amount into a share dealing account and purchase shares in a company. You would pay commission to open the position, 0.5% in stamp duty and the full £10,000 will be tied up in your chosen shares with any profit or loss based on that exposure. The same £10,000 worth of exposure can be secured with a CFD for a fraction of the initial outlay thanks to leverage, with the risk and reward the same as if £10,000 worth of traditional shares were held. But should you not be interested in leverage, you can always treat CFDs like shares. Simply deposit £10,000 into a CFD trading account and take the equivalent CFD position which will tie up as little as 20%/£2000 (note that overnight financing costs will still apply). The remaining £8,000 is not tied up, so you can use some of that to take advantage of another short-term opportunity elsewhere, or simply leave it on the account to support any losses. Best of all, using a CFD means you pay no stamp duty![/vc_column_text][/vc_column][/vc_row][vc_row][vc_column width="1/1"][vc_column_text]
What’s your view?
Think shares will rise? Take a long position by buying CFDs (buy low, aiming to sell high). Think they’ll fall? Take a short position by selling CFDs (sell high, aiming to buy low). For a more detailed rundown of CFDs, their mechanics, associated costs and some trading scenarios download our ‘Comprehensive Guide to CFDs’ here.[/vc_column_text][/vc_column][/vc_row]
[vc_row][vc_column width="1/1"][vc_column_text]
The Accendo Markets Research Offering
Does your current broker’s morning report tell you all you need to know about yesterday’s news? If so, how is it offering you anything more than the plethora of information already available on the internet?
We’re proud that our morning editorial has become a hot commodity in the City, its content quoted daily by the journalists that are writing the news everyone else will be reading later in the day, if not the next. Our morning report tells you what’s driving the market at that moment and what to look out for in the day ahead.
If a company has reported earnings before the market opens, we’ll tell you why the shares are called to open up or down in relation to that announcement.
As well as the Morning Report, signing-up to Accendo Markets Research & Trade Ideas offers you the chance to receive the following publications:
- Another Level: A selection of key level alerts on various stocks.
- Index Focus: A selection of key level alerts on the major indices.
- Trade Alerts: Trading ideas from our analysts. What do they think is likely to move?
- Macro Calendar: Live market-moving data, breaking news as it happens
- Week in Advance: A summary of next week’s key events. Is there a trading opportunity there for you?
To ensure you can act as quickly as possible, you’ll receive an email with a link to the latest publication as soon as it’s released. You can unsubscribe from these emails at any time.
Based on a wealth of experience, gained from both large and small institutions, our Research and Trade Ideas are produced in-house. Our team of dedicated professionals comprises both analysts and traders, drawing upon a wide range of resources and methodologies.
Our aim is to provide you with the manpower and expertise you need to help you clarify, interpret and capitalise on the ever-growing volume of market information.
The journalists don’t pay for it and neither do you, so why not give it a go? You’ve nothing to lose and perhaps a little more to gain…[/vc_column_text][/vc_column][/vc_row]
This research is produced by Accendo Markets Limited. Research produced and disseminated by Accendo Markets is classified as non-independent research, and is therefore a marketing communication. This investment research has not been prepared in accordance with legal requirements designed to promote its independence and it is not subject to the prohibition on dealing ahead of the dissemination of investment research. This research does not constitute a personal recommendation or offer to enter into a transaction or an investment, and is produced and distributed for information purposes only.
Accendo Markets considers opinions and information contained within the research to be valid when published, and gives no warranty as to the investments referred to in this material. The income from the investments referred to may go down as well as up, and investors may realise losses on investments. The past performance of a particular investment is not necessarily a guide to its future performance.
Prepared by Michael van Dulken, Head of Research