Markets Overview: (Source: Bloomberg, FT, Reuters, DJ Newswires)
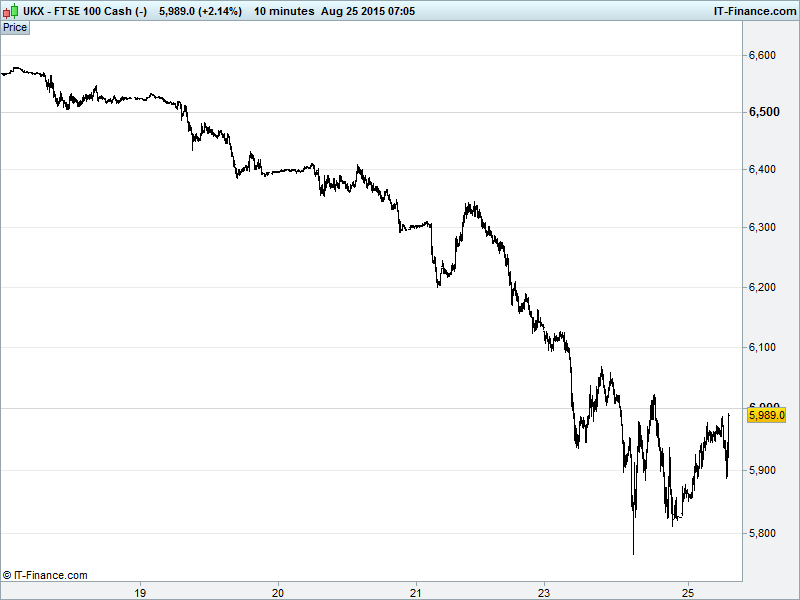
UK 100 called to open +80pts at 5995 after a terrifying global equity sell-off Monday that saw Wall St. in particular fall by over 1000pts before rallying. UK Index found support at 5860, bulls looking to regain 6000 support while bears getting ready to ride another sell-off. Watch levels: Bullish 6100, Bearish 5750
The positive opening call comes with little consolation after what happened yesterday – UK 100 closing down 250pts amid a wider global equity rout that’s saw Wall St. lose 1000pts after the US open.
US stocks suffered their worst session in four years on Monday, with markets spooked by concerns about the global economy and the prospect of interest rate hikes. Treasuries meanwhile were bolstered by the losses seen at the open of Wall Street as US equities fell sharply.
Elsewhere, Fed’s Lockhart said he expects the normalization of monetary policy to start sometime this year and to proceed gradually with rates remaining low for quite some time. USD appreciation, Yuan devaluation and the further decline of oil prices are complicating factors in predicting the pace of growth, however.
Asian stocks rebounded overnight from early losses as a recovery in US futures helped soothe investor sentiment and fears about the falls on China's stock market – the curious case of the Shanghai Composite bucking the asian trend to extend recent losses, now down 600pts on yesterday’s open.
Steep slides in equity markets and fears of a China-led slowdown in emerging economies are upending hopes in much of Europe that strong global growth and a weak euro would boost the region’s limp recovery. Oxford Economics’ Ben May stating that “The eurozone is very vulnerable to shocks.”
With the Greece can kicked a bit further down the road, Europe’s economic drivers have moved east to faltering emerging markets and west to a limp US recovery – a little limper than policy makers there would like. Where will the world’s growth engine fire up now?
In focus today will be the global indices! Will they recover? Is this just the beginning of something much bigger?
Data-wise we have German IFO business climate, current assessment and expectations looking flat to slightly softer in August, while US highlights include new home sales and consumer confidence this afternoon looking positive, while Richmond Fed manufacturing activity is set to be down in August.
The oil spotlight now firmly on Saudi Arabia as Crude prices continue to plunge – Brent now at $43 while US Light well below a widely slated psyche level at $38. The question now raised is this: Could the world’s largest exporter of oil now move to restrain production in the hope of stabilizing prices and protecting its OPEC comrades, but at the expense of market share?
Gold holding below 7-week highs $1170, tracking USD and global market volatility and hence lacking direction. If this morning’s equity rebound turns out to be more short covering, look for a re-test of $1700 while a continued stock market recovery could spell downside for the yellow metal. Keep an eye on those emerging market currencies though.
For any help you may require placing trades or in terms of market information, put a call in to our trading floor – it’s all part of the service.