Markets Overview: (Source: Bloomberg, FT, Reuters, DJ Newswires)
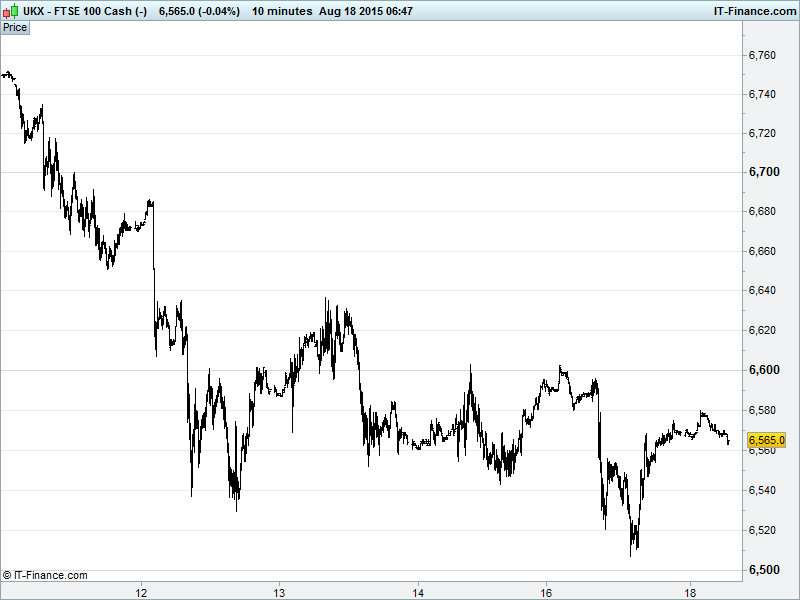
UK 100 called to open -10pts at 6549. 6 days of falling highs have the potential to breach July rising lows 6540 and continue the downtrend from 10 Aug towards 6500 and a breakout from the June narrowing pattern. Bulls will be looking for the strength of those rising lows to prevail, while bears will note the formation of a 5-day falling channel on the hourly chart with the index trading off its ceiling. Watch levels: Bullish 6650, Bearish 6500
The negative opening call comes following a stateside rally following a dire Empire Manufacturing print that fell way below expectations, the fallout proving short lived with markets seeming confident after some initial jitters that the New York area to which the survey referred need not be a barometer for the whole of the US.
Meanwhile, Asian stocks defied encouraging cues (the US rally; Chinese property price deflation slowing in July) to trade mixed overnight. The Shanghai composite is down the best part of 5% this morning as a lack of trust in Chinese macro data compounds both Chinese and global growth concerns. Mainly Chinese though…
Japan’s Nikkei dipped after growth concerns re-emerged yesterday as Shinzo Abe’s government was seen to require a bigger quiver to house a few extra ‘arrows’. That is to say, further monetary easing.
Aussie ASX gained on confidence the weak AUD is indeed helping the country bounce back from the commodities slump and convert itself from a mining based to a… something else based economy.
In Europe, deep wounds begin to open within Greece’s ruling Syriza party that, together with rumblings from inside Berlin, threaten to derail bailout talks. Greek MP’s poised to hold a vote of confidence in Alexis Tsipras after Yanis Varoufakis eviscerated the latest agreement – clearly finding consensus in many of the more radical factions within the Greek government.
In focus today we have UK inflation data expected to show a worrying contraction on the month while remaining flat at 0.0% on the year at 0930, this having grave consequences where hawkish elements of the BoE are concerned, though they’ll argue that it’s better to get going on a rate rise sooner rather than later (by that we mean as soon as possible after the US Fed makes its own move). US housing starts and building permits looking mixed in the afternoon.
Oil suffering (surprise surprise..) as weighty stockpiles continue to build, putting pressure on prices that isn’t set to abate until 2018 under current conditions – those being global oversupply, a firm USD and Iranian contributions to the glut. In other news, the US has signed an agreement to export some of its crude to Mexico in an historic move. The US has until now had an export ban in place on its oil. WTI holding around $42 while Brent sitting at $48.
Gold ($1119), it’s said, is benefitting from poor US macro data, although we would argue that it’s not been behaving as an in-favour safe haven for a long time. With the USD strengthening over the past week, risk-off investors are more likely to be heading that way. Currency worries in the Asia pacific region still far more likely to be bolstering the yellow metal as an alternative currency.
For any help you may require placing trades or in terms of market information, put a call in to our trading floor – it’s all part of the service.
UK Company Headlines: (Source: Reuters/DJ Newswires)
- Nationwide warns new £300m tax bill will hit lending
- John Wood says wins a Gabon contract from Shell
- Wood Group says has cut about 13% jobs since Dec
- Cairn Energy expects to begin Senegal drilling ops in Q4
- Royal London posts strong H1 new business while investment returns lag