Markets Overview: (Source: Bloomberg, FT, Reuters, DJ Newswires)
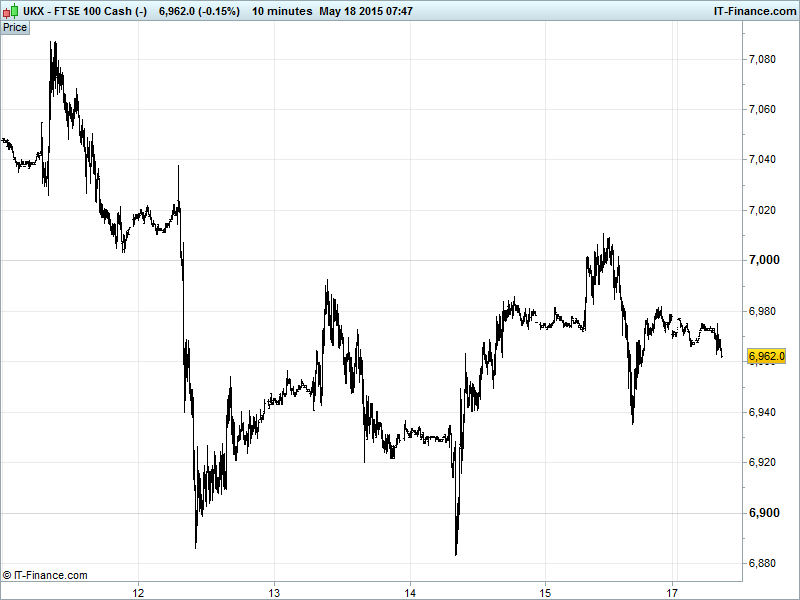
UK 100 Index called to open flat at 6960, having bounced off Friday’s lows of 6935 but failing to better 6981 overnight, ushering the index into an ever narrowing range, all the while in a falling trend since mid-April. While holding above 100-day Moving Average (6920), note difficulty in bettering the 50-day MA since falling below the indicator last Tuesday. Bulls still eyeing recovery rally to 7127 highs while bears look for more another test, if not breach, of 6900. New watch levels: Bullish 7020, Bearish 6930.
The flat opening call comes after a mixed Friday performance in the US saw the Dollar weaken considerably on lacklustre macro data – a disappointing University of Michigan Sentiment reading in particular. In Europe, Greek PM Tsipras continues to insist that a deal with creditors will be reached with no net effect on public sector wages and pensions in the country as domestic banks continue to haemorrhage capital and tap the ELA provided by the European Central bank, which is itself likely to be maxed out within three weeks.
A leaked IMF memo indicates that Greece will be unable to make its 5 June loan repayment if a deal is not made as strained negotiations continue with the Greek government unwilling to back down on pledges it made to end austerity. The Eurozone QE programme is going as planned, according the ECB’s Mersch, with no signs as yet that it will be ended prematurely.
US bourses closed mixed Friday with largely mark-missing macro data failing to hinder the S&P500 index on its climb to new all-time highs. Fed hawks remained on the wing, supported by firmed inflation expectations which will leave a 2015 US rate rise on the table after a June hike was all but written off in Fed commentary last week.
Asian stocks delivering an even more mixed session than US peers as investors digest weak data (US, China) and IPOs overshadowing demand for equities in the region, as well as the prospect of a fresh week of Greek uncertainty regarding debt payments.
Japan’s Nikkei outperforming, led by insurers, thanks to stronger than expected corporate earnings, a weaker JPY, hopes of share buy-backs and despite mixed macro data. Chinese stocks mostly higher thanks to rallying smaller company shares countering concerns about a rotation out of listed shares into IPOs. Aussie equities names dragged down by miner BHP Billiton after spin-off South32’s IPO.
In Focus today, a quiet one on the macro-front, we have the US NAHB Housing Market Index looking for a 1-point improvement in May. If hit this would be a minor indicator of US economic recovery and an ‘amuse bouche’ ahead of weightier future New Home Sales and MBA Mortgage Applications prints from the world’s #1 economy.
Overnight, UK House Prices maintain trend of slowing annual price growth, while China Property Prices showed signs of stabilisation with April declines the same as March, and flat on the month. Ratings agency Fitch has affirmed Greece’s CCC rating, expecting the government to survive the current liquidity squeeze but with a default a real possibility. It also left the Netherlands at AAA thanks to its strengthening recovery while peer S&P left Italy at BBB, benefiting from diversified economy.
Brent ($67) and US Light Crude ($61) both spiking this morning amid Middle-East unrest with renewed Saudi bombing in Yemen following last week’s humanitarian ceasefire and news that ISIL has captured the Iraqi city of Ramadi. Resistance in the form of Iran indicating that OPEC output cuts are unlikely and US shale companies getting back to work on production likely to cap significant gains
Gold benefiting from its best rally since January thanks to a weaker USD fuelled by more weak US Data, helping the yellow metal break out to 3-month highs $1230 as we write. After 6-weeks sideways, could we see a repeat of the mid-March $80 rally completing around $1260? Watch for breakout level serving as support for any pull-back. Greek uncertainty also helping with capital flight seeing banks running short of collateral. Support $1223, Resistance $1245.
For any help you may require placing trades or in terms of market information, put a call in to our trading floor – it’s all part of the service.
Key Overnight Macro Data: (Source: Reuters/DJ Newswires)
- UK House Rightmove Prices Growth slowed
- China Property Prices Deflation slowed
- Japan Industrial Production Declines accelerated
See Live Macro Calendar for full data line-up, incl. consensus expectations
UK Company Headlines: (Source: Reuters/DJ Newswires)
- BHP Billiton spin-off has cautious debut, valuing South32 at $9bn
- BHP Billiton hunts for deepwater oil assets
- British chocolate maker Thorntons says CEO to step down
- Inmarsat trims outlook on delay to third Global Xpress launch
- Fresnillo says 2018 silver production target remains in place
- JKX Oil & Gas gets areal extension to Elizavetovskoye production licence
- Cranswick full – year revenue rises marginally
- Baron Oil PLC – Commencement of drilling operations – Islandmagee
- Babcock confident of long term, after strong demand boosts profit
- South32 to begin trading on ASX, LSE and JSE
- Mitie profit held back by local government cuts
- Two Afren non – executive directors to leave company after AGM
- Sirius Minerals Plc – Brazil Potato and Tomato Crop Study Results