Markets Overview: (Source: Bloomberg, FT, Reuters, DJ Newswires)
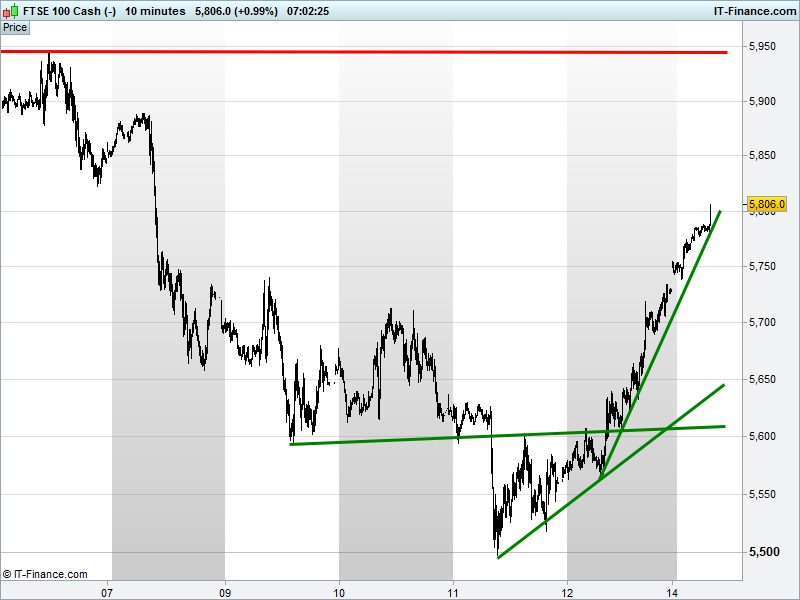
UK 100 Index called to open +100pts at 5805, keeping with Friday’s accelerated uptrend, putting on another 100pts overnight to break beyond February’s downtrend at 5700. Nonetheless, a longer-term chart shows us still within a 4-month falling channel with upside potentially capped at 6000. Watch levels: Bullish 5820, Bearish 5770.
The positive opening call comes after a strong Asian session amid hopes that the recent banks-led global market rout was overdone and more stimulus was primed after poor Chinese trade data and Japanese GDP and Industrial Production missed. Bad news is good news, again.
Japanese stocks rallied sharply (+7%) on Yen weakness and poor data while Chinese stocks recovered significant ground from initially strong post-holiday losses despite the Yuan rising its most since 2005 on PBOC comments about currency support after big capital outflows and recent USD weakness which gave commodities prices and Aussie miners a boost.
Gold pulled back along with Yen as safehaven interest wanes amid the equity rally, however, while banking sector worries may have calmed, macro woes can’t exactly be consigned to the bin - negative rates means new world, China slowdown real, US recessionary risk feasible, commodities still in depression, uncertainty about central bank ability to rescue, again.
Add geopolitics to the mix with the west accusing Russia of targeting Syrian refugees and Saudis suggesting Assad could be ousted by force and the new week is set to be just as interesting. The UK PM Cameron also enters his final final week of negotiations on the UK’s future on the EU (Brexit).
A rally on Friday left US markets positive after depressed energy and financial stocks rebounded strongly with the former benefiting from oil price strength and the latter simply looking oversold. Note US bourses closed today for President’s day.
In focus today, with monetary policy and negative rates such a key driver of recent events, we have Draghi speaking before the European Parliament's Committee on Economic and Monetary Affairs with questions from its Members. Data wise with a US holiday, we have only the Empire State Manufacturing Index and the NAHB Housing Market Index, with the former seen improving on its negative read and the latter flat.
Corporate-wise, note major bank HSBC electing to remain domiciled in the UK, putting to bed months of uncertainty about a shift back to Hong Kong, where its shares traded 3.5% higher.
Equity markets in part tracking a recovery in the oil price with a weaker USD on a dovish Fed outlook assisting, as is continued chat about oil supply - though no indication that producers are ready to act together in output cuts. Technically, the US crude chart is showing resistance around $29.50 with upside towards $32 if this is broken. Nothing on the Brent chart to suggest its own uptrend is under threat.
Gold has come back from 12-month highs after a more risk-on sentiment dominated financial markets Friday. Note the daily RSI and Stochastics have dropped back from overbought to test rising support.
For any help you may require placing trades or in terms of market information, put a call in to our trading floor – it’s all part of the service.
UK Company Headlines: (Source: Reuters/DJ Newswires)
- Acacia Mining's FY core profit falls on lower gold prices
- BAE Systems names oil exec Charles Woodburn as COO
- Hornby says CEO Richard Ames to step down with immediate effect
- Hammerson full – year net rental income rises
- Shell says BG scheme now effective
- HSBC has elected to remain headquartered in the UK
- Reckitt Benckiser FY sales beat estimates on health focus