Markets Overview: (Source: Bloomberg, FT, Reuters, DJ Newswires)
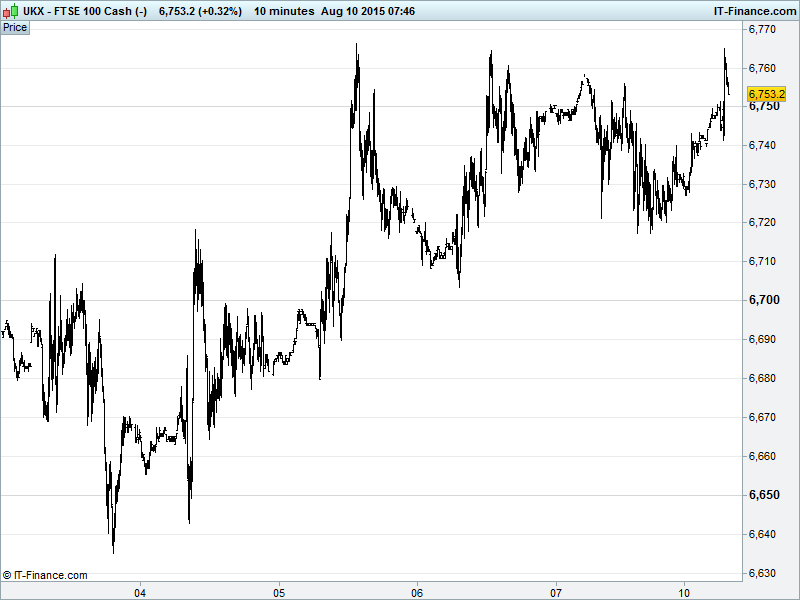
UK 100 Index called to open +35pts at 6755, still in uptrend and rebound from recent 6500 lows and continuing to test 6760, a level which proved troublesome in the second half of last week due to falling highs from June 4 and 200-day moving average. Prospect of non-textbook bullish inverse Head & Shoulders reversal towards 7000 still in play. Watch levels: Bullish 6775, Bearish 6715.
The positive opening call comes courtesy of poor China Trade and Inflation data increasing speculation of more stimulus from Beijing to ensure 7% GDP target is hit, offsetting slowing growth jitters, as well as rising optimism that the latest Greek bailout deal could be arrived at ahead of schedule (tomorrow?). This in the face of rising bets that Friday’s US jobs report was strong enough to push the Fed towards a September rate hike.
Asian stocks mixed overnight, swinging between gains and losses, in the wake of weak macro data confirming a slump in Chinese exports and negative producer price inflation extending to 41 straight months (a PBOC official said this could extend to 50!). While Copper made fresh 6yr lows overnight it has since recovered >$5150/ton, but Oil remains weak after China data and Friday’s US rig data maintained supply glut fears.
Equities in China outperforming (best 2-day run in a month), still supported by massive government and regulatory intervention, delivering strong gains thanks to speculation the government will accelerate mergers in state-owned Industrials and Telecoms, offsetting negative economic data, although the latter surely means more growth-fostering stimulus on its way.
Japan’s Nikkei posting moderate gains with investors still weighing up a largely positive earnings season against weak Chinese data while Australia’s ASX is doing a little better thanks to a rebound by the banks, a weaker AUD and hopes of more China stimulus providing a trade boost (biggest export market) to the key commodities.
US Dow Jones futures recovering this morning following a red close for US bourses on Friday. Monthly headline Non-Farm Payroll additions fell to 215k in July, missing consensus while June’s figure was revised up giving (and this is the important bit…) a net two-month gain of 14k. The unemployment rate was steady at 5.3%, all making a strong case for US Fed hawks regarding a September interest rate rise with the resultant USD volatility rippling through the commodities markets – notably gold.
UK media stocks followed US counterparts lower with ITV (ITV) and Sky (SKY) shares suffering on outlook concerns, despite posting decent enough earnings themselves, after a string of disappointing stateside reports last week – most notably Disney which rocked investor confidence in the sector somewhat.
In focus today will be unrelenting fallout from the US Jobs report and what it means for Fed rate rise timing. Thereafter it’ll be speculation about the Greek bailout deal and whether it will in fact come early or a bridge loan still be required
Data-wise, the latest Eurozone Investor Confidence is expected to show improvement in August, while in the afternoon the July reading for US Labour Market Conditions could add spice to the US rate hike discussion as could the Fed’s Lockhart’s latest comments following his September hawkishness last week (“need big deterioration to change my mind”).
Gold ($1096) sideways now since late July with a nigh on $20 range providing some good opportunities for swing traders, especially amid macro data-driven US Fed rate rise speculation. Still, however, stuck near those 5-yr lows, hindered by the USD and other, more attractive safe haven options while China continues to add pressure via hopes for more economic stimulus.
Crude prices posted a fourth day of declines with more US rigs coming online to add to the glut in global supply. Are competitive US drillers finding confidence in reports that Saudi Arabia’s coffers may be running low at current prices? Elsewhere, bullish bets on oil increased for the first time in 7 weeks (net long positions up 13% according to the CFTC) - a move widely seen as having come too early with the ‘black gold’ still very much in a bear market. Brent currently at $48 while US Light Crude trading around the $43/$44 level, both in a downtrend since early June.
For any help you may require placing trades or in terms of market information, put a call in to our trading floor – it’s all part of the service.
UK Company Headlines: (Source: Reuters/DJ Newswires/Bloomberg)
- Nostrum Oil & Gas makes possible $50m offer for Tethys Petroleum
- Fastjet says July passengers +36%
- IG Group's CFO resigns to join investment firm Hargreaves
- Meggitt to Buy Cobham's Advanced Composites Businesses
- Carillion Wins UK Government Contract
- esure Group Half Year Gross Written Premium Up
- Tethys Petroleum: Update on $47.7m financing; $5m Loan financing and possible offer from Nostrum Oil & Gas
- Dixons.Carphone suffered a cyber-attack at the weekend