Markets Overview: (Source: Bloomberg, FT, Reuters, DJ Newswires)
UK 100 called to open +30pts at 6555, continuing to make progress on its bounce from a near test of 2014 lows on Thursday (after the ECB disappointed on the no-hints-of-QE front) thanks to a strong US jobs report on Friday rekindling belief in US recovery (and global knock-on) and its ability to live with higher borrowing costs.
US stocks closed higher on Friday as traders factored in stronger than expected September US Jobs report headline numbers (more jobs added and big upward revisions, unemployment down) and a narrower US trade deficit which boosted USD. Nonetheless, the participation rate worsened as did the broader U6 measure of unemployment, and there was no sign of wages growth, which may worry the Fed.
As markets got excited and added momentum to their reversal from recent sell-offs/corrections, the IMF warned the US Fed to provide clear communication on its exit from current accommodative monetary stance in order to avoid another ‘taper tantrum’.
Asian stocks are mixed overnight in spite of a positive US lead with geopolitical concerns a hindrance, namely Hong Kong protests and Syrian conflict (more tragic ISIS action again this weekend), as well as increased attacks in East Ukraine and the World Bank being the latest to cut its China growth forecast to 7.4% (from 7.6%) for 2014 and 7.2% (from 7.5%) for 2015.
Japan says typhoon Phanfone has caused no extensive damage, even if economically it has meant travel disruption and factory shutdowns. Nikkei equities helped by stronger USD and thus weak JPY after the US Jobs report. Australian equities in the red likely on China growth forecast cuts and weaker AUD.
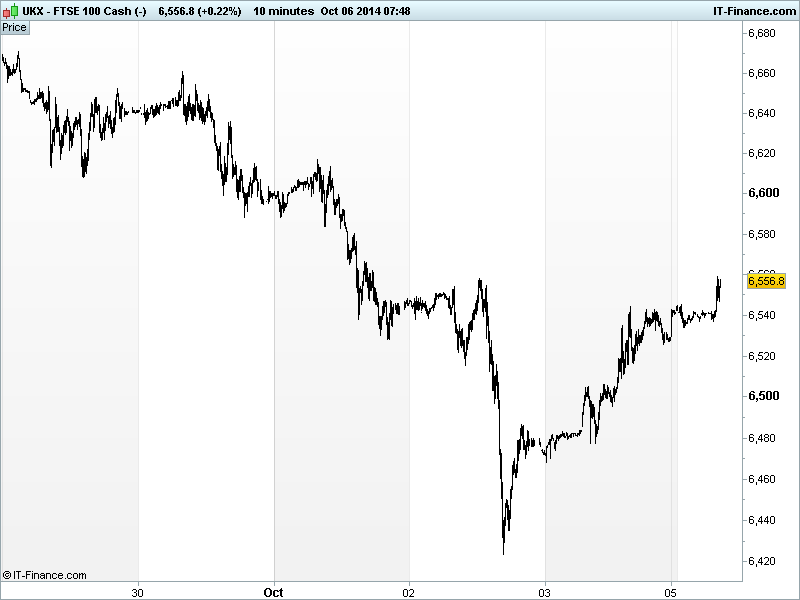
The UK 100 index is currently testing 6550 (3-day bullish inverse head & shoulders pattern?) having bounced from lows of 6423 on Thursday and thus making progress in terms of recovery towards the 6900 September highs from which we fell. Daily RSI just recovered from oversold. Correction over and recovery started?
In focus today, we have Eurozone PMI Retail figures on which there is no consensus but all were in contraction in August so any signs of growth would surely be welcome after some poor Eurozone data (CPI, PPI, PMI Manufacturing,, PMI Services) last week. The Eurozone Sentix Investor Confidence is seen deteriorating in October.
In commodities, Gold has made a new 2014 low of $1183 but has recovered to trade above $1190 as we write. Platinum and Palladium have tumbled in tandem dented by the US jobs report seeing the USD strengthen (makes commodities more expensive) and economic recovery sapping safehaven demand as well as the China growth forecast cuts suggesting les industrial demand. Oil continues to leak on speculation Saudi Arabia will maintain output, even as US/Russia build supplies and signs of slowing demand mount.
For any help you may require placing trades or in terms of market information, put a call in to our trading floor – it’s all part of the service.
Key Overnight Macro Data: (Source: Reuters/DJ Newswires)
- DE Factory Orders Miss, plunged
See Live Macro Calendar for full data line-up, incl. consensus expectations
UK Company Headlines: (Source: Reuters/DJ Newswires)
- Cranswick sees full-year performance in line with board's expectations
- BCA Marketplace says plans to list in London
- BG Group says received $350 mln from Egypt for gas debt
- Daisy Group takeover extension deadline moved to Oct 20
- Faroe Petroleum awarded new licensing options in the Celtic Sea, Ireland
- Tesco strengthens board with two new non-exec directors