Markets Overview: (Source: Bloomberg, FT, Reuters, DJ Newswires)
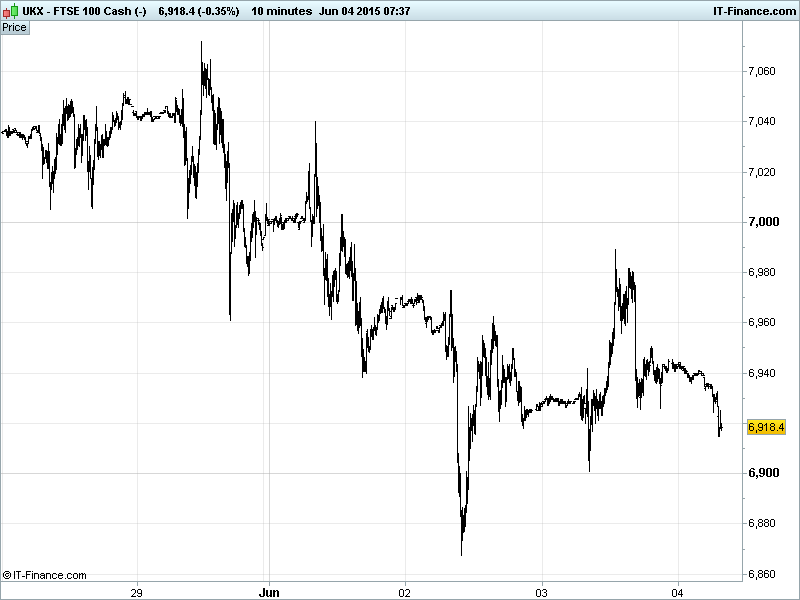
UK 100 Index called to open -30pts at 6920 after yesterday’s rally met resistance at a trend line of falling highs from 7070 last Friday. This keeps the index at the lower end of the April converging pattern with a second successive test of support signalling potential for the downtrend to continue. Failure to stay above 6930 also increases the likelihood of the bearish double-top pattern completing (6800). The close below 100-day MA is also significant. Watch levels unchanged: Bullish 6960, Bearish 6860.
The negative opening call comes in the run up to Friday’s deadline for a €300mn Greek debt payment to the IMF. Talks in Brussels between Alexis Tsipras and European Commission chief Jean-Claude Juncker were described in positive light but little detail after French PM Hollande had earlier suggested Greece and creditors were on the brink of a deal with reports this morning hinting that some concessions have been made by the Eurogroup in its continuing negotiations with a defiant Tsipras & Co. Watch out for early-doors market reaction to that one.
US bourses closed positive on Wednesday on optimism of a Greek deal while some good macro data (ADP employment change, trade deficit) shored up the markets there. Fed chat this time from notable dove Evans and hawk Bullard sounding like a couple of stuck records – Evans saying a rate hike unlikely in 2015, best way to raise rates is gradually; Bullard continuing to insist first quarter shortcomings were due to ‘temporary factors.’ Nothing new from the Fed, then.
Asian equities mostly in the red, despite a positive finish on both sides of the pond and fresh optimism from a Greek agreement with creditors (when, when?) as Tsipras held late-night talks and there was talk of the IMF getting its money on Friday 5th (or maybe the 14th, ha!) and comments from several officials (pinch, salt) of progress (who made concessions?) The USD was kept in check by mixed US data and dovish Fed chat (Evans) even if Bullard tried to counter.
Australian equities lower following its break below technical support 200-day MA with a big widening of the trade deficit and flat retail sales weighing heavily (index on track for biggest weekly loss in 2 years). Chinese stocks underperforming again despite reports of cross-border investment for foreign branches of large banks.
Japan's Nikkei bucking trend as the JPY rises versus the EUR/USD on Greek optimism, comments from Draghi about faster EZ inflation and bond market volatility and some mixed US data (ADP in-line, Beige book rosy outlook, ISM & PMI Services weaker). Sideways since 26-May. Pause before rally or retreat?
In Focus today we have German construction PMI at 0830 and Eurozone retail PMI at 0910. At midday the UK’s BoE rate announcement not expected to announce anything other than 0.5% while US jobs data at lunchtime is looking to improve in May. See the live macro calendar for a full rundown with consensus.
Gold prices eased back to $1800 support despite the fallback of the USD. Falling highs from mid-May highs of $1230 intact. Bounce or break? Lack of safehaven demand failing to engineer a yellow metal recovery from recent lows while lack in inflation on both sides of the Atlantic saps demand for it as a hedge.
US Light Crude ($59) and global benchmark Brent ($64) have fallen back within their May/June sideways channels amid a Chinese stock sell off and despite a 5th straight drawdown in US stockpiles.
Meanwhile, OPEC supply chatter continues to indicate market oversupply will not end any time soon with the group of major oil producing economies, led by Saudi Arabia, continue in their battle to retain market share in the face of an increasingly self-sufficient US. The aim appearing to be to curb the rise of shale by keeping crude prices below a level at which frackers can begin to compete.
For any help you may require placing trades or in terms of market information, put a call in to our trading floor – it’s all part of the service.
UK Company Headlines: (Source: Reuters/DJ Newswires)
- Sports Direct finally appoints new finance chief
- Wincanton FY revenue increases marginally
- Acacia Mining names Michelle Ash as chief operating officer
- Smith & Nephew removes smaller components of hip replacement system from market
- Petrofac extends revolving credit facility
- Petrofac secures Oranje – Nassau Energie contract
- Pets at Home says appointed Ian Kellett as CEO of retail division
- Johnson Matthey profits rise, expects stronger year ahead, raises dividend
- easyJet reports passengers +7.2% in May
- Vectura Group plc VR942 Phase I clinical study commences