Markets Overview: (Source: Bloomberg, FT, Reuters, DJ Newswires)
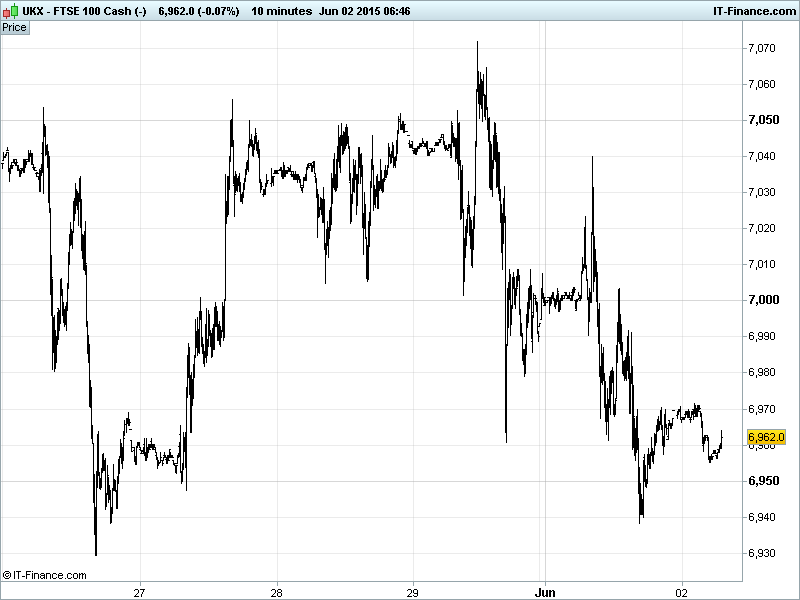
UK 100 Index called to open +10pts at 6965, after a volatile 100pt range session saw a test near recent highs and lows. While the revisit just shy of May 26 lows 6930 (and 100-day MA) offers the chance of a bullish double-bottom rebound, it could also be the break-down point for a bearish double-top pattern formed over the last 7 sessions. At lower end of longer-term converging pattern awaiting signal or break higher or lower. Watch levels: Bullish 7010, Bearish 6920.
The positive opening call comes after choppy trading conditions Monday with UK 100 closing negative as poor European, but especially Chinese manufacturing data hit the big miners. All was quiet on the Greek front bar brief and quickly suppressed Twitter speculation that a deal was to be announced in the afternoon which, if nothing else, gave UK Index swing traders something to bite on.
An emergency meeting took place in Berlin last night between key creditors who all agree that work needs to intensify as time runs out for Greece to make its June loan repayment and avert a default. Attendees were the IMF’s Lagarde, ECB’s Draghi, French PM Hollande and EC President Juncker with the notable absence of the Greek PM who again lambasted the Eurogroup’s stance in a French magazine earlier in the week.
US equities had a good day on Monday, closing up following US macro data that pleased otherwise nervous investors. Nerves, however, capped significant upmoves. The US Fed’s Rosengren said that it wasn’t appropriate to comment on whether the economy’s poor Q1 performance was due to ‘temporary factors’, and added that they’re not yet ready to raise rates.
While US manufacturing data (PMI, ISM) was good, inflation and spending was lacking in the face of rising income (not spending lower oil price benefit) adding to the murky data and conundrum that the Fed faces in terms of when to raise rates. This may serve to cool recently heightened expectations of Fed definitely hiking rates later this year should more data and better trends be required.
Asian equities in the red after better-than-expected US manufacturing data suggesting a brighter US outlook heightened expectations of the Fed raising rates sooner rather than later. This led to cautious trading and was weighed up against doubts about Greece’s ability to make debt payments after another evening passes without a creditor accord.
A strengthening USD and weakened Asian FX offered limited support to regional export names while a positive US finish (muted gains ahead of Jobs report on Friday) and M&A news (Intel buying Altera; $16.7bn) failed to buoy Far East sentiment. China still rebounding on PBOC talk of plenty more room for further RRR cuts to stimulate economy.
Japan’s Nikkei below water, failing to repeat its 1988 13-day climb, despite the JPY falling to a 12-year low against the USD after strong US factory data and continued expansion in JPY monetary base and real wages showed their first gain in two years delivering good news for the PM’s Abenomics.
Downunder, Australia’s ASX is the region’s underperformer, falling below yesterday’s lows, despite a China rebound, with the stronger USD weighing on commodity prices and the RBA offered no explicit easing guidance on rate policy.
In Focus today we have German unemployment data, UK consumer credit and mortgage approvals with an increase expected in loans secured against dwellings – UK housing market looking bullish then? Eurozone CPI this morning is looking for an increase in the rate of inflation which would mean the ECB’s QE programme continues to function as desired, while US factory orders come through in the afternoon with a contraction expected, indicating bearish business sentiment in May.
US Light ($60) and UK benchmark Brent Crude ($65) appear now settled into sideways channels with both trading close to upside resistance. US Dollar Basket helping prices, having tested and broken below rising support this morning with horizontal support likely around 97 giving potential for further upside to the oil price today.
Gold: After a sharp rally above $1200 on USD weakness following income/spending/inflation data and comments from the Fed’s Rosengren that were less supportive of a Fed rate rise the USD recovered on stronger manufacturing data which brought the yellow metal all the way back. Support at 1180 still valid thanks to Greece uncertainty. Watch for major moving averages proving a hindrance for any further rallies.
For any help you may require placing trades or in terms of market information, put a call in to our trading floor – it’s all part of the service.
UK Company Headlines: (Source: Reuters/DJ Newswires)
- Amec Foster Wheeler wins four contracts from SP Energy Networks
- Amec Foster Wheeler sees further decline in 2015 trading margins
- BATS says subsidiary to appeal against Quebec tobacco class action judgements
- Stagecoach says Abellio JV shortlisted for East Anglia franchise
- Londonmetric buys five M&S Simply Food stores for 26 mln stg
- Wolseley Reports Rise in 3Q Earnings
- British Land Co Launches GBP350M Convertible Bond Offering
- Magnolia Petroleum Plc Participating in 16 New US Onshore Wells
- St. Modwen Sees 1H Profits Ahead of 1H14
- AO World FY Loss Narrows, Trading Conditions in UK Remain Challenging
- Sona Petroleum Aborts Plan to Buy Stake in Salamander Energy Assets
- Premier Oil concludes two separate transactions on Solan project