Markets Overview: (Source: Bloomberg, FT, Reuters, DJ Newswires)
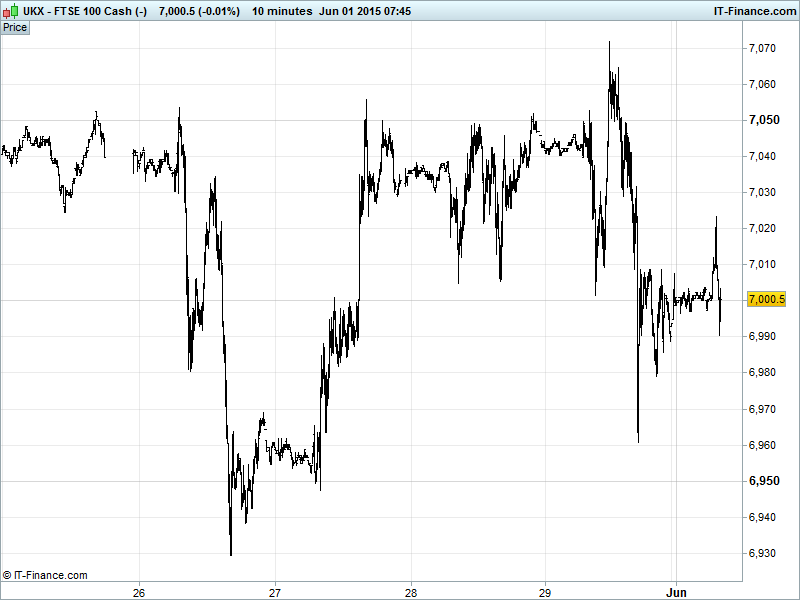
UK 100 Index called to open +15pts at 7000, with the index having bounced from Friday’s late test of 6960 to regain 7000 and sit back in the middle of the current converging pattern; April rising lows at 6930 and falling highs at 7050. The former may dominate, but the latter still requires a decisive breach to allow delivery of another upside leg. Watch levels: Bullish 7030, Bearish 6975.
The positive opening call comes after a chaotic Friday afternoon that saw European and US equities sell off ahead of an uncertain weekend as continued Greek debt negotiations again took centre stage. With a deal clearly not having been reached by yesterday (Sunday), Greek officials are said to have now prepared a draft agreement which is expected to be presented to creditors today.
Markets seemingly encouraged by the news this morning and while the outcome will be, as always, anyone’s guess, there is a very real feeling now that time is running out.
US markets also suffered from some disappointing macro data with annualised GDP deteriorating considerably and the Chicago PMI dropping below 50, a bearish indicator for US business conditions. Note this week is Non-Farm payrolls week with all eyes likely firmly fixed on Friday.
Asian equities mixed following a weak EU/US Friday close as investors weigh up the health of the US economy as we move towards the latest US jobs report, consider the importance of this week for Greece in terms of its arduous debt negotiations moving into another week and digest overnight macro-economic data from the world’s #2 economy.
Equities in China rebounding after last week’s weakness helped by Manufacturing PMIs adding to hopes of further stimulus (improved, but Official read by less than hoped and HSBC’s print still in contraction) and bargain hunting following a technical correction. Fears of overheated markets (equity, housing) still remain.
Japan’s Nikkei trending water thanks to Manufacturing PMI swinging back to expansion, the weak JPY and a surge in Capital Spending data. Progress impeded by profit taking following an impressive 11-day run.
Australia’s ASX is the regional underperformer despite a rebound in Manufacturing PMI and Company Operating Profits/Inventories after Building Approvals and House Prices slid and last week’s USD rebound keeps a lid on commodity prices.
In Focus today we have Manufacturing PMIs for France, Germany, the Eurozone and the UK looking mixed. This afternoon sees German CPI followed by US Personal Income and Spending and its own Manufacturing PMI. Again, mixed consensus. See the live macro calendar for a full run-down of today’s data.
Oil prices broke out above falling resistance (now turned support?) over the weekend, helped by a pullback in the USD and the Baker Hughes Rig Count posting a 25th straight drop in the number of operational US drilling rigs. Both US light ($59) and Brent Crude ($65) since pulled back from weekend highs to trade in miniscule ranges yesterday and this morning with attention likely stolen by Eurozone brinksmanship.
Gold holding around $1190, still creeping higher, helped by technical rising support from mid-March at $1190 and 2-month horizontal support $1180. However, hindered by strong USD rebound from 3-month lows to regain levels last seen a month ago and a lack of panic regarding Greece (we’ve been here before, we’ll probably be back here again).
For any help you may require placing trades or in terms of market information, put a call in to our trading floor – it’s all part of the service.
UK Company Headlines: (Source: Reuters/DJ Newswires)
- Circle Oil full – year revenue falls 9 pct
- Sierra Rutile says study confirms viability of dry mining Sembehun
- Aldbrough UK gas storage site in unplanned deliverability outage – SSE
- Kaz Minerals says Bozshakol copper mine on track for commissioning in Q4
- Playtech to buy Plus500 for 459.6 mln stg
- Mears Group to buy Care UK's Care at Home division
- Roxi Petroleum says aggregate consideration for Galaz sale will be $100 mln
- Britain to launch Lloyds retail share offer in next 12 months
- UK to extend trading plan for sale of Lloyds shares
- Gulf Keystone appoints Maersk executive as CEO
- Management Consulting Group confirms in talks to sell part of Kurt Salmon unit