Markets Overview: (Source: Bloomberg, FT, Reuters, DJ Newswires)
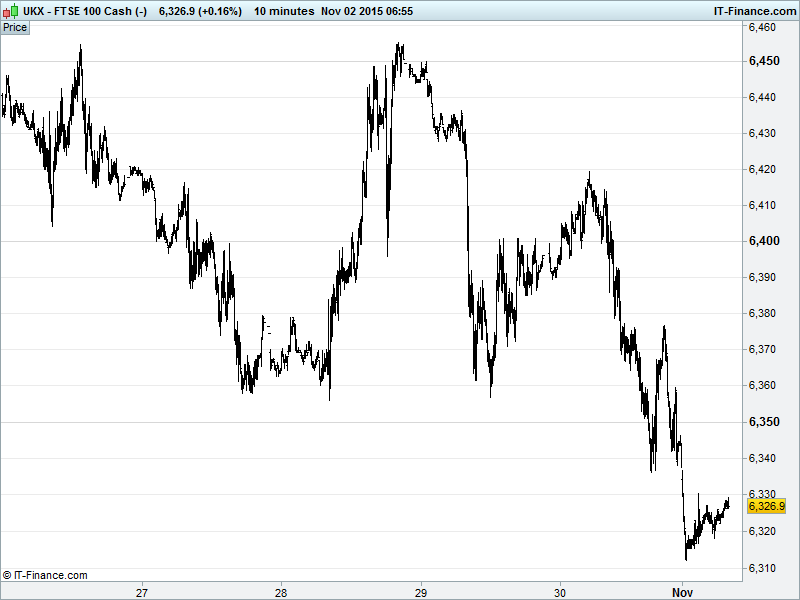
UK 100 Index called to open -35pts at 6325 having broken down from the 4-week bearish rising wedge pattern we had been highlighting, and a late Friday rally finding resistance at the breach. While October was a strong month, this starts November on the back foot, especially with a bearish flag pattern around 6320 that could complete around mid-October lows 6260. Updated watch levels: Bullish 6345, Bearish 6295.
The negative start to November comes after Asian stocks followed US counterparts lower. This after weekend data showed China’s Official PMI Manufacturing failing to meet consensus hopes of a return to breakeven, staying in contraction for a third month and reviving global growth woes, while this morning’s Caixin read improved but made it 8 successive months of contraction.
Japan’s Nikkei is the underperformer (-2.1%) while Chinese stocks make it their longest decline in 2 months (-1.6%) after corporates reported falls in profits and macro data disappointed. Australia’s ASX -1.4% is also under the cosh (China’s biggest trading partner) with metals still under pressure from a stronger USD and China data.
Wall Street bourses closed down on Friday with consumer goods and tech weighing on US indices, while energy stocks (Chevron (CVX), Exxon Mobil (XOM)) benefitted on bullish oil supply outlook via a 9th straight week of declines in operational US drilling rigs. Fed chat continues with the US central bank still desperate to have us all believe it might actually take action to normalise policy this year with Williams reminding us all that December is a live meeting while economic data remains the key metric.
Interesting to see how the Fed might react to China’s liquidity injection into the bond markets, that potentially weakening both Euro and Yuan, thus strengthening the USD. Such a situation surely makes it less likely that Yellen & Co. will act hawkishly before year-end. Peer action becoming increasingly important.
In corporate news, note HSBC (HSBA) reporting Q3 profits +32% beating consensus thanks to reduced operational and litigation costs. A sign of the times comes from German bank Commerzbank (CBK) resuming dividends after an 8 year hiatus. Note budget airline Ryanair (RYA) continues to put flagship carriers to shame with Q2 profits +41% and the traditional mid-year guidance increase.
The data focus today will be dominated by Manufacturing PMIs from the UK, Europe and US which are all seen holding in growth while we have comments from the ECB’s Linde and Fed’s Williams and Q3 results from AIG, Visa and Loews. Note this week we have the Bank of England’s (BoE) super Thursday (policy, minutes, inflation report) as well as US jobs report on Friday.
Crude prices settled higher after that Baker Hughes rig count, the number of operational US rigs now 1/3 of what it was this time last year. Note, however, that this one piece of weekly data is unlikely to take Oil prices back above $50 (Brent) or $48 (WTI) given the suitably massive contribution to the markets from control freak OPEC (read Saudi Arabia), with that only really set to grow.
Gold is still heading down towards the floor of its 3-month rising channel having moved down below Friday’s $1144 support level. That was spurred by a Fed-related spike in USD, although the Dollar has now retraced much of its 28 Oct up-move. Still watching for a technical bounce off $1126 or thereabouts.
For any help you may require placing trades or in terms of market information, put a call in to our trading floor – it’s all part of the service.
UK Company Headlines: (Source: Reuters/DJ Newswires/Bloomberg)
- Flybe says redeploys remaining surplus Embraer E195 aircrafts
- 2G Energy announces supply agreement with COGENCO Ltd
- Quindell says to pursue a two stage distribution of 100p/shr
- Hikma lowers full – year revenue guidance for generics business
- John Laing says buys solar PV portfolio for £18.8m
- Centrica: UK's North Morecambe gas sub – terminal flows resume after outage
- Shell completes two divestments from downstream portfolio
- IP Group's portfolio company Ultrahaptics raises £10.1m
- Ophir Energy drills dry well in Gulf of Thailand
- British Land says lets first floor of marble arch house to Cirrus Logic
- Morgan Sindall says group performance in line with its expectations
- Ryanair 2Q Net Profit Rises 41% in 2nd Quarter