Markets Overview: (Source: Bloomberg, FT, Reuters, DJ Newswires)
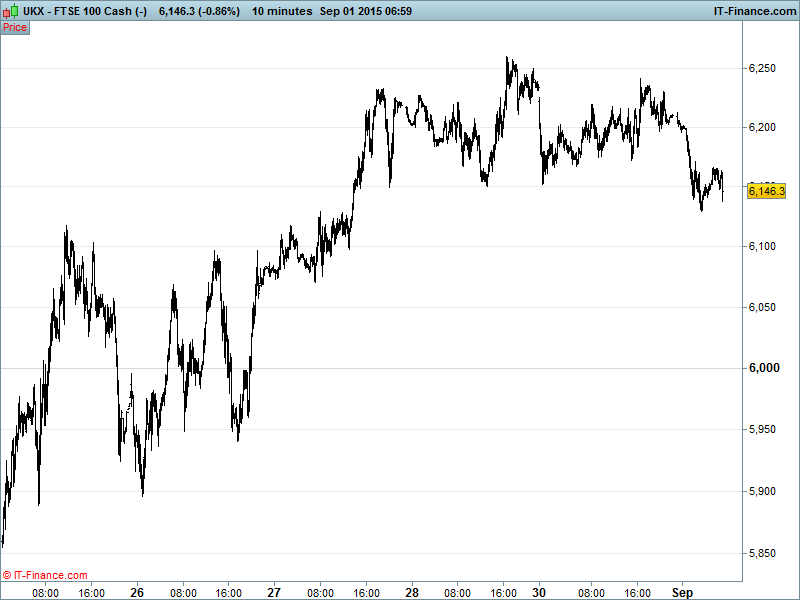
UK 100 Index called to open -128pts at 6122 with last week’s bounce from 5800 having faltered around 6200 and fallen back below the 1-week supportive trend of rising lows. Note the breakdown at 6150 of a potential 3-day 100pt bearish Head & Shoulders top pattern. Traders asking whether this is pause before another leg up, or merely the resumption of the ugly downtrend since mid-August. Watch levels: Bullish 6175, Bearish 6090.
The negative opening call sees September start on a downer with risk appetite sapped by more disappointing China PMI data –manufacturing contracting to 3yr low as Beijing stimulus effort fail to deliver, maintaining investor anxiety about the impact of economic slowdown on global growth. The Services sector may remain buoyant (expanding, but more slowly) but this is offering little relief.
Uncertainty about a Fed September rate rise also lives on after conflicting comments from FOMC members over the weekend regarding international events. In Greece, note former parliamentary speaker Constantopoulou supporting newly formed anti-bailout party by leftist Syriza rebels ahead of this month’s snap election
US stocks moved lower on Monday after a soft but positive close last Friday – energy stocks supporting US bourses on an oil price rebound. Yesterday’s reversal came as Chinese manufacturing data disappointed yet again, compounding the majority-held fears that the world’s #2 economy is contracting.
Reports from the FT that the Chinese government has decided to abandon attempts to boost its stock market through large-scale share purchases have simply added to woes, but there’s some way to go before one can say the Chinese economy is actually in recession.
All that aside, with US Fed VC Fischer telling CNBC on Friday that it was too early to determine whether recent market turmoil would impact the likelihood of a September rate hike (it’s September now, Mr. Fischer!), attention will surely be diverted towards Friday’s Non-Farm payrolls report with US market moves likely to be more sensitive to that than recent EM volatility.
Asian markets really struggling to shake off tough and highly volatile August after US indices closed the month lower (worst since May 2012) and Chinese stocks extended their summer rout with the PBOC moving to curb currency speculation after last month’s devaluation but scepticism rife that government intervention (directly and via ‘encouragement’) can shore up equities.
OPEC, now officially concerned about the drop in crude prices, this morning signalling it’s ready to talk to other producers about how best to navigate the current situation. In focus could well be the group’s ‘fragile five’ which together contribute one third of OPEC crude production (the same as Saudi Arabia). Could Saudi Arabia be signalling a willingness to give up some market share by curbing production with the knock-on effect of shoring up prices? Traders seem to think so, a view that’s given both WTI ($47) and Brent Crude ($53) a 25% boost since 24 August lows.
Gold ($1142) back on the offensive (or is it the defensive?) benefitting from poor manufacturing data out of China and safe haven demand ahead of Friday’s US jobs data, both of which could be the cause of some market and currency volatility this week. Rising channel since 26 Aug. $1146 a target for the bulls and $1136 support for the bears.
For any help you may require placing trades or in terms of market information, put a call in to our trading floor – it’s all part of the service.
UK Company Headlines: (Source: Reuters/DJ Newswires)
- Valeant gets right to develop AstraZeneca's psoriasis drug
- Bwin confirms revised offer from 888 Holdings
- Rentokil acquires pest control business Steritech for $425 mln
- Carlyle makes 40 pence per share offer for Innovation Group
- Electra agrees merger, refinancing of Park Resorts Group