Markets Overview: (Source: Bloomberg, FT, Reuters, DJ Newswires)
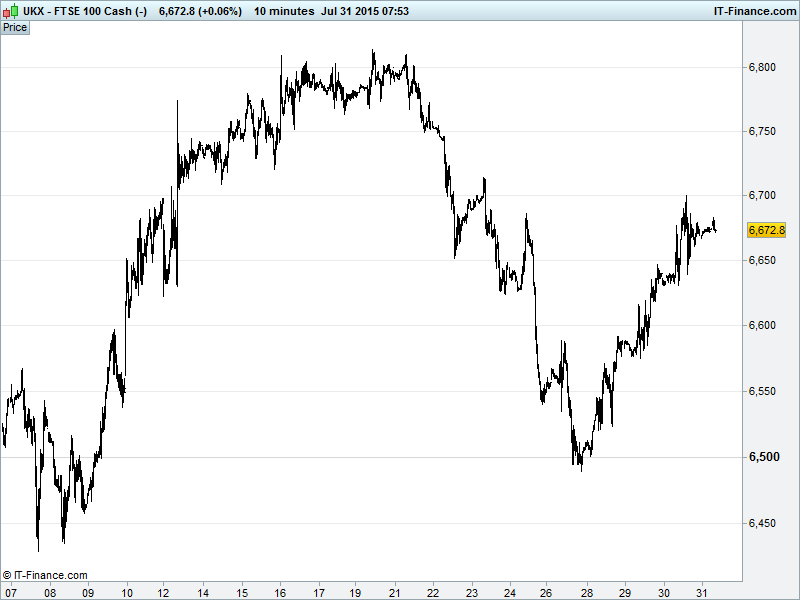
UK 100 Index called to open flat at 6670, holding its rebound from 6500 lows towards recent highs 6815. Trendline of rising support at 6670 could allow for test of 6700, equating to 61.8% retracement of recent declines. However, beware falling highs and 200-day MA at 6765. Updated watch levels: Bullish 6705, Bearish 6645.
The flat opening call comes as forecast-beating European Q2 results, which would otherwise underpin recovery sentiment into the week-end, are being offset by several US and EU corporates (incl. Peugeot, Audi, Ford, CAT, Siemens, VW) explicitly highlighting a slowing China as a risk to future growth.
On the Greek front, PM Tspiras will hold an emergency Syriza party congress in September to try and regain control of the more radical left-wing coalition party members opposing current bailout talks, adding to risk of re-elections.
The IMF is also piling pressure on both Athens and Eurozone creditors, saying bailout deal can’t be done without ‘specific and clear agreement on lightening Greek debt’. The wheels coming off deal already? It’s possible the Greek stock exchange could reopen Monday.
In the wake of the Fed update, note USD recovery to near recent highs on speculation the US Central Bank is moving closer to a rate hike which has given Asian stocks a boost but weighed on the key commodities space overnight with oil headed for its worst monthly drop this year. It’s also been another volatile equity session in Shanghai
US markets closed little changed on mixed earnings (Amgen and Broadcom beat but P&G, Facebook and WholeFoods weighing), Q2 GDP growth missing forecasts, falling commodities prices and China jitters.
Asian bourses traded largely higher overnight following late Thursday rallies on Wall St. and despite a strong US dollar continuing to pressure the commodities sphere. Mixed Japanese macro data kept gains muted (Nikkei flat) with CPI coming in a little better than expected, but only a little, highlighting the fact that the BoJ’s inflation target remains some way off.
In spite of continuing super-QE, low oil prices (set to continue in the mid- to long-term?) are likely to be stifling inflation growth in both Japan and the US. Other Japanese prints into the mix included a slightly higher unemployment rate (missing consensus) and lower household spending (well below expectations).
A weak Chinese open also provided a market headwind into Friday’s session with considerable volatility in the Shanghai Composite, as the relationship between the country’s stock market and economy at large continues to be analysed. The belief is that fundamentals in the world’s #2 economy are not supportive of current equity valuations.
Aussie stocks positive on a temporary respite for commodities and the prospect of further weakening of the AUD in the wake of US Fed interest rate hike chatter.
In focus today will be Eurozone Unemployment and Consumer Price Inflation (CPI) at 10am with forecasts for a tick down in the former and confirmed positive albeit sub-target readings for the latter. In the afternoon, we have the Chicago PMI at 2.45pm and Uni of Michigan US Consumer Confidence at 3pm with improvements seen in both.
Oil prices under pressure…again….following an impressive go at a rally on Wednesday (both WTI ($49) and Brent ($52) putting on $1 a barrel). Nonetheless, crude prices are set for their biggest monthly drop this year as the bear market takes hold and global supply glut worries continue (Iran deal, Iraq exports up, US inventories above 5-year seasonal average). All this prompted OPEC’s Abdullah al-Badri to all but demand that prices go back up again. Saudi Arabia starting to feel the pinch then?
Some Gold ($1084) watchers now looking at a return to pre-2009 sub-$1000 levels as the yellow metal fails to shine as a safe haven, investors likely preferring interest bearing assets like US treasuries as the USD surges back towards 21 Jul highs and beyond. Support holding around current level $1084 but week-long falling highs providing bearish near-term outlook.
For any help you may require placing trades or in terms of market information, put a call in to our trading floor – it’s all part of the service.
UK Company Headlines: (Source: Reuters/DJ Newswires/Bloomberg)
- Lloyds sets aside further $2.2bn for mis – selling redress
- BG Group Q2 profits halve as oil price drop bites
- IAG on track to meet annual target, Aer Lingus almost in the bag
- Vedanta Resources says its Zambian power supplier to cut power
- AO World names Mark Higgins as finance chief
- IMI sees remainder year organic revenue lower than H1 result
- Optimal Payments says FCA not concluded evaluation of Skrill deal
- KCOM says performance remains consistent with expectations
- Balfour Beatty JV named preferred bidder for £460m Hinkley Point package
- Moneysupermarket.com share placing raises £37.2m