Markets Overview: (Source: Bloomberg, FT, Reuters, DJ Newswires)
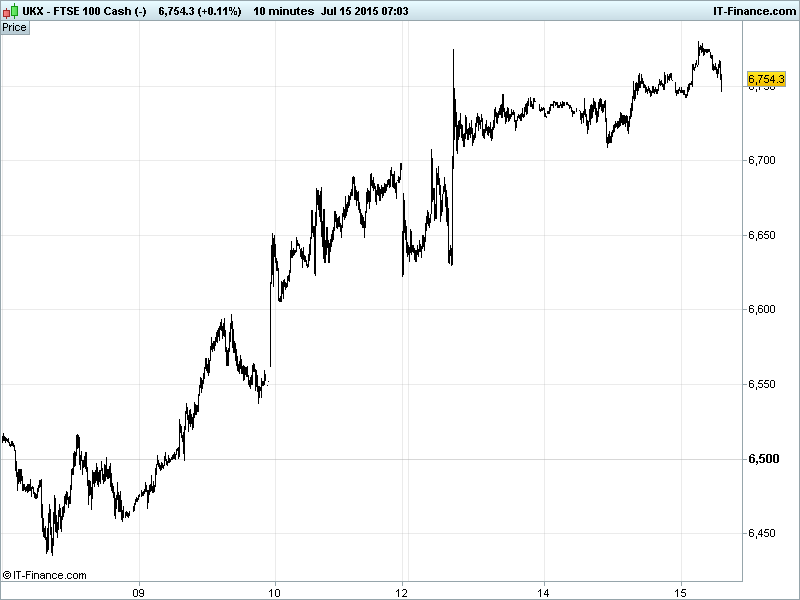
UK 100 Index called to open flat at 6755 having finally broken out above the trend of falling highs from end-May to test the 200-day moving average 6752. With a 9-month uptrend still valid after the recent bounce, there is potential for 7000 to be regained, however, after recent sharp gains of 250pts some fatigue may be encountered. Watch levels: Bullish 6810, Bearish 6690.
The flat opening call comes despite China’s overnight GDP data beating expectations, holding the key 7.0% level versus consensus forecasts of a drop to 6.8%. Q2 resilience thanks to policy stimulus (and an equity boom, no bust) has dampened hopes of more being forthcoming, thus keeping the bulls from the door and another down day for Chinese equities.
Uncertainty surrounding Greece’s bailout also continues to weigh, and not just in terms of political hurdles for Tsipras today, with the IMF stunning Europe (echoing calls from US) by saying it may walk away from the current deal if Athens not given massive debt relief, which Germany staunchly rejects, in order for its debt pile to become sustainable and allow it return to debt markets.
US markets delivered their first four-day run of gains since January (Dow back >18000) helped by semi-conductors and biotech and disappointing US Retail Sales which only went to add to speculation of a delay in the US Fed’s interest rate lift-off, even if the Fed’s George said the economy is ready, “it’s time” and Chair Janet Yellen prepares to testify later today.
Asian markets mixed after Chinese GDP growth data came in at 7%, beating consensus and proving cause for concern among analysts who fear the data may be being cooked by the Chinese office of statistics (a charge vehemently denied with authorities touting the better than expected print as being ‘hard won’).
Shanghai Composite lost 3% in the morning session – not because investors didn’t believe the data, but because the positive print will pour cold water on the likelihood of further economic stimulus measures. So markets want further economic stimulus to get the economy rolling, but when it is rolling they head for the exit. Confused?
The Aussie ASX is again the outperformer in the region as commodity prices continue to stabilise – most notably crude oil with energy stocks the winners down under, while Japan’s Nikkei up again after the BoJ pledged to continue QQE until 2% inflation is stable, maintaining its assessment of the economic recovery as ‘continuing… moderately.’
In focus today will be the Greek parliamentary vote on the bailout deal as well as the outcome of the Eurogroup’s conference call on much needed bridge financing for Athens. There after there are a host of Fed speakers before the US Beige book economic update in the evening. Data-wise look out for UK Unemployment and Wages and US Industrial Production both seen improving in June.
Oil prices settled into a sideways range as traders quickly got over the Iranian nuclear deal yesterday with both Brent and WTI now testing the ceilings of $2 and $3 ranges respectively. Bulls hoping for a breakout above resistance at $58 for Brent and $54 for WTI while bears betting on a pull-back to support.
Gold still feeling the downwards pressure from those end-June falling highs with risk-off traders desperately trying to maintain buying momentum in the face of a seeming change of job description for the yellow metal, which is little changed this morning at $1155.
For any help you may require placing trades or in terms of market information, put a call in to our trading floor – it’s all part of the service.
UK Company Headlines: (Source: Reuters/DJ Newswires/Bloomberg)
- APR Energy extends contract for Guatemala power project
- Burberry sales growth slows in first quarter
- Workspace says rent roll up 8.9% for quarter to June 30
- ICAP says trading volume reduced by uncertainties surrounding Greece
- Severn trent sees trading performance in line with its expectations
- Hochschild Mining says on track to achieve 2015 production target
- Vodafone: drops off Goldman's Europe buy list
- Marwyn sells 26.5m depositary interests in Entertainment One
- British pub firm Wetherspoon warns new living wage to hit industry