Markets Overview: (Source: Bloomberg, FT, Reuters, DJ Newswires)
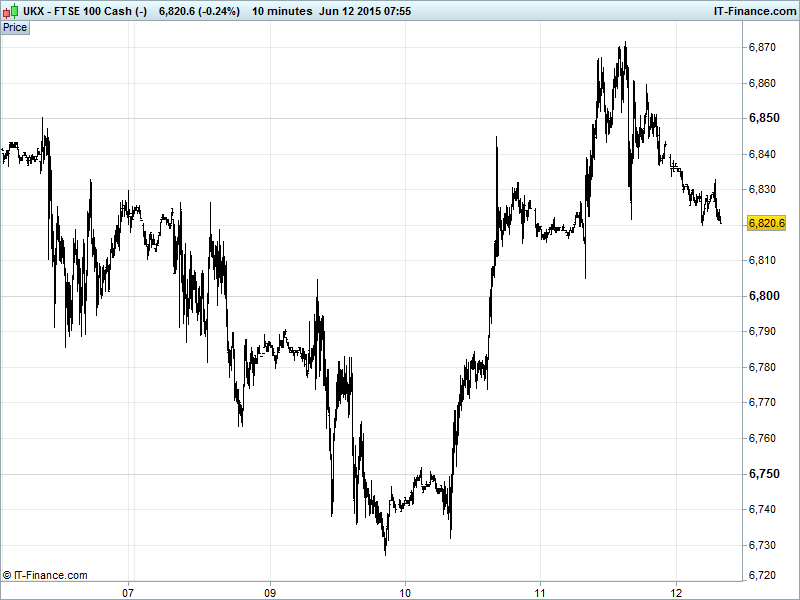
UK 100 Index called to open -25pts at 6820, with resistance at 6870 resulting in a fall-back to prior overnight consolidation level 6820. The Bulls hope to see uptrend revival with support holding around 6805, however Bears hopeful that yesterday’s breakout from falling channel was more of a ‘fake-out’ and that further downside will be delivered towards 1 April lows 6670. New watch levels: Bullish 6885, Bearish 6790.
The negative opening calls in Europe come after the equity recovery saw an about-turn late yesterday on news the IMF had packed its bags and left Athens with Greek debt negotiations breaking down once again due to ‘major differences’ continuing to scupper a deal.
Creditor rhetoric become notably aggressive towards Greek PM Tsipras in terms of continued backtracking on ‘progress’ (EU says ‘gambling’ must stop; talk of ‘time-wasting, incompetence and deviousness’) as clock ticks towards key debt payments, the coffers run dry and default/Eurozone exit becomes distinct possibility.
US stocks held on to slim gains, although less than those seen in Europe, with better than expected US Retail Sales giving a boost to hopes that the US is back on the road to recovery after a difficult Winter dealt a blow to at the start of the year. The USD delivered a predictable bounce in reaction, with the data seen adding to case for that much feared Fed rate hike.
Asian equities largely positive, but only just, echoing Wall Street’s close, and with caution evident amid the Greek news outweighing the positive US Retail Sales report and solid Jobless Claims update.
Japan’s Nikkei benefiting from Industrial Production data showing much improvement in April with a return to growth in April. The stronger USD has also helped weaken JPY back from its recent Kuroda-induced strength, benefiting exporters, despite BoJ comments about being able to hold wait on stimulus expansion.
China outperforming, resuming their uptrend despite reports of foreign capital outflows with hopes that the PBOC will this weekend deliver stimulus by cutting banks’ Reserve Requirement Ratios in an effort to spur economic growth, succumbing to recent weak domestic data and its own forecast downgrades. Ratings agency Moody’s has also said China made much progress on reform.
Australia’s ASX under water due to the stronger USD hindering commodities and sentiment dented by shares in Rio Tinto’s (RIO) Australian Uranium unit halving overnight as RIO withdrew support for expansion of one of the biggest uranium mines due to nuclear industry difficulties following the 2011 Fukushima disaster.
In focus today we have Eurozone Industrial Production which is seen rebounding in April from contraction in March. In the afternoon, US Producer Price Inflation is seen improving to inflationary territory likely helping the USD by buoying the case for a Fed rate hike. The Uni of Michigan is expected to tick back up after its dropping to a 6-month low.
Gold’s bounce from weakness yesterday has only got as far as prior resistance $1185 which revives the downtrend from mid-May. Major moving averages around $1193 (100- and 200-day) look like proving a hurdle, along with renewed USD strength. Greek uncertainty keeps safe-haven demand alive, but less so than might otherwise be expected.
Oil prices hindered by strong USD, taking Brent off its recent $66.6 highs and keeping US Light in downtrend from 10 Jun.
For any help you may require placing trades or in terms of market information, put a call in to our trading floor – it’s all part of the service.
UK Company Headlines: (Source: Reuters/DJ Newswires/Bloomberg)
- Avocet Mining says positive results from Souma drilling campaign
- Segro says to dissolve Heathrow Big Box JV with M&G Real Estate
- Segro Takes Full Ownership Of Heathrow Property as Joint Venture Ends
- Petra Diamonds sees FY revenue around $430 mln
- Petra Diamonds Reaffirms Output Put Warns On Revenue
- UK telecom regulator proposes lower prices for high–speed BT business lines
- SThree says H1 gross profit up 14 pct
- Tullett Prebon says business initiatives to add to costs annually by less than 1 pct of revenue
- Tullett Prebon Plans Further Expansion, Diversification to Improve Results
- Shares in Rio Tinto’s Australian uranium unit halve
- Ted Baker 18-Weeks Revenue Up; On Track to Meet FY16 Expectations