Markets Overview: (Source: Bloomberg, FT, Reuters, DJ Newswires)
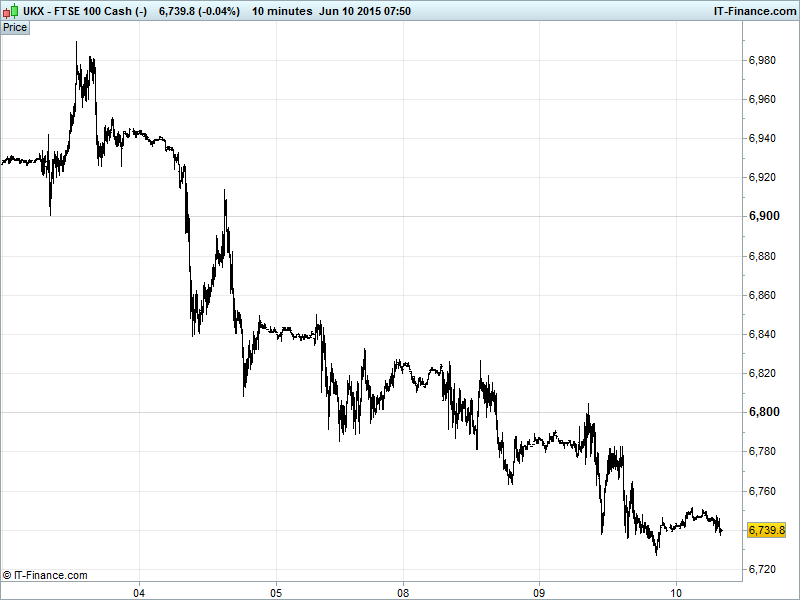
UK 100 Index called to open -15pts at 6740, having recovered from overnight low (6725) but now struggling to better 6750 under weight of negative global news-flow and resistance via falling highs from 3 Jun. Testing 200-day MA 6747. Note current sell-off extended to 330pts in 9 days while last 2 rallies took 10 days to deliver 350+ points. Are we any closer to a reversal, or worse to come (6670 April lows)? Watch levels: Bullish 6765, Bearish 6720.
The mildly negative opening call comes after US stocks closed flat yesterday following a tech sell off that continued to cap a recovery. In Asia the PBoC cut its GDP and inflation estimates – to be taken as a bullish sign of additional stimulus to come. The above just about managed to quell Eurozone unease as Greek PM Tsipras heads to Brussels on Thursday for more talks with Merkel and Hollande.
European banks back in the spotlight after S&P and McGraw Hill Financial downgraded several UK and German institutions including Deutsche Bank, Barclays and RBS overnight (Deutsche now at BBB +ve - just two notches above junk status), considering future government support ‘uncertain’ meaning the term ‘too big to fail’ may be losing relevance. Investor sentiment dented as a result to keep European equities under pressure this morning.
US bourses were the subject of a tug of war between gains in energy stocks and a tech sell off that ultimately ended in stalemate with a more or less flat close. Tuesday also saw some good data releases in the world’s #1 economy with small business optimism, wholesale inventories and JOLTS job openings (best since Dec 2000) all beating forecasts.
Asian stocks mixed, swinging between gains and losses after a negative European and breakeven US close as energy names and commodities benefit from continued USD reversal and consumer shares slipped.
Japan’s Nikkei and its exporters hindered by a JPY surge to 2 week highs (bouncing from 13yr lows) thanks to stable PPI deflation readings double whammy of continued USD reversal and comments by BoJ governor Kuroda that “it was hard to see the [already very weak JPY] currency falling further”. Is he calling the JPY or the USD, and by default the Fed’s rate hike timing? Ballsy!
China stocks rebounding thanks to PBOC cuts to 2015 growth and inflation estimates being taken as positive for stimulus and thus equities following weak trade and inflation data this week. Gains are also in spite of MSCI putting on hold the inclusion of China mainland ‘A’ equities in its benchmark indices due to regulatory obstacles. Optimism had been high that a positive decision would lead to big capital inflows.
Australia’s ASX positive, with the miners benefiting from China stimulus hopes and the weaker USD helping commodities push higher. A weaker AUD also helped thanks to RBA governor Stevens saying the currency needs to fall further and open to further policy easing to support sustainable growth. Consumer confidence readings (weekly and monthly) were mixed.
In focus today we have industrial & manufacturing production from several European nations including the UK (@0930). Consensus sees a reduction in all but manufacturing production YoY. Later in the morning we’ll get we’ll get Greek CPI and US mortgage applications. See the live macro-calendar for a full rundown.
Crude prices edged up again yesterday with US Light breaking through $60 again and benchmark Brent hitting $66 this morning as lower US shale output forecasts and reports that Saudi Arabia is upping production in reaction to growing demand supported prices in such a way as to give crude its biggest boost so far this month.
Gold managed to recover back to $1180 thanks to weaker USD but still within a downtrend from mid-May with resistance at $1190. Plenty of global concerns to buoy safe haven demand.
For any help you may require placing trades or in terms of market information, put a call in to our trading floor – it’s all part of the service.
UK Company Headlines: (Source: Reuters/DJ Newswires/Bloomberg)
- Synergy Health says Steris and co agree to extend long-stop date for deal
- Flybe Group FY pretax loss 35.6 mln stg vs 8.1 mln stg profit year ago
- Malin Corporation invests $35 mln in Melinta Therapeutics
- Sainsbury's sales fall for sixth straight quarter
- Weir says oil and gas division proving very challenging