Markets Overview: (Source: Bloomberg, FT, Reuters, DJ Newswires)
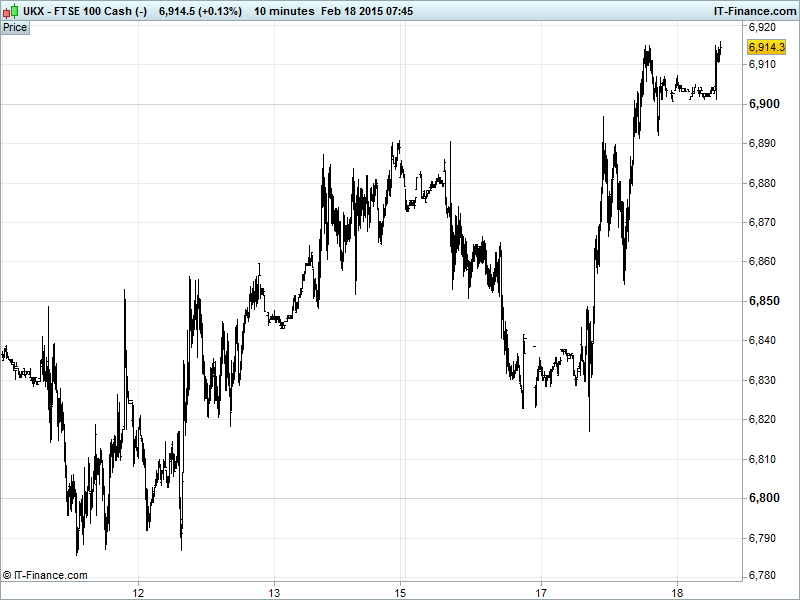
UK 100 Index called to open +15pts at 6915, having made it above the key 6905 level (resistance since Sept 14) and managing to stay above 6900 overnight. After the bounce from 6820 and with rising Feb support intact, the chance of a revisit of all-time highs 6950 is a distinct possibly. Watch levels Bullish 6920, Bearish 6890.
The positive open comes as talks between Greece and the Eurogroup continue this week with PM Tsipras indicating yesterday that, while he remains absolutely committed to forging an agreement with the creditors, the two parties remain far from striking a deal. Nonetheless, it is reported that the Syriza government may request a 6-month extension of its bailout today and that will no doubt calm the waters slightly.
The ECB has indicated impatience with the situation by suggesting that it may start to pull the plug on Greek banks soon as more retail customers begin to pull deposits while indications are that a fresh election will be called if negotiations fail completely.
US markets pushed higher overnight after the President’s day holiday as risk appetite grew on the positives from the Greek talks - Tsipras is likely to request a bailout extension today and this appears to have been singled out by investors despite the accompanying uncertainties (election speculation) – and this helped the S&P500 to top all-time highs 2100.
In Asia markets also traded higher following positive cues from Wall Street and again taking the good bits from the Eurozone. Trading volumes were light in the region due to Chinese Lunar New Year closures while in Australia, good business sentiment data helped the ASX gain significant ground.
In focus today we have UK employment data not expected to improve markedly following yesterday’s disappointing inflation and housing reports, with all this continuing to lean against those in favour of a UK rate hike this year. US housing, industrial production and inflation data is also due which will presumably throw some weight either beneath or on top of the Fed’s own stance on raising its rates – widely accepted as being increasingly hawkish.
Gold ($1208) continues to slide during Asian trading as tepid demand ahead of the annual Chinese Spring Festival weighs on sentiments. Thin liquidity is expected for the next 2-weeks while the Chinese market, one of the most important demand centres for the yellow metal, is out for Lunar New Year holidays. Hawkish US Fed chat has also pushed down safe-haven demand. Gold is firmly back in its downtrend from Jan highs with $1200 a key watch level.
Oil dipped on Wednesday, pausing from the recent strong gains over the past two weeks which many analysts say were exaggerated, but has since recovered, helped by growing geopolitical worries in the Middle East with the sabotage of a key Libyan pipeline cutting production. Fresh US stockpile data is expected on Thursday with a further increase highly likely to weigh on prices. Brent and WTI were at $62 and $53 respectively this morning.
For any help you may require placing trades or in terms of market information, put a call in to our trading floor – it’s all part of the service.
Key Overnight Macro Data: (Source: Reuters/DJ Newswires)
- Australia Conference Board Leading Index Accelerated
- Australia Westpac Leading Index Improved
- Japan Machine Tool Orders Solid
See Live Macro Calendar for full data line-up, incl. consensus expectations
UK Company Headlines: (Source: Reuters/DJ Newswires)
- Russia's Rosneft reserves replacement ratio at 154 pct in 2014
- RSA Insurance sells stake in Indian insurer to JV partner Sundaram Finance
- Coca – Cola HBC sees 'challenging' year after Q4 profit falls
- SSE comments on energy market investigation
- APR Energy says Iraq contract renewed till end of 2015
- Galliford Try hikes dividend on strong house building demand
- Blinkx appoints chief product officer